
A critical review of the definition of soil springs in the available design guidelines – Part – I: Axial Soil Springs
Axial soil resistance plays an important role for pipeline stress analysis or pipeline design against the landslides along the pipelines. There is a significant difference in the two current design guidelines (ALA 2005 and PRCI 2007) in defining the axial resistance of soil. Furthermore, the recommended values do not match very well with some physical test results, and the current practice might be a dangerous oversimplification for specific cases! This blog will guide you towards the questions/loop holes that have been identified from a critical review and require further research.
Preface:
The axial pipe-soil interaction is generally represented by bi-linear soil springs in the current industry practice. The current design guidelines (e.g. ALA 2005 or PRCI 2017) defines the peak axial force per unit length (Tu) using the equations listed in Table 1.
Table 1: Equations for Tu based on current design guidelines
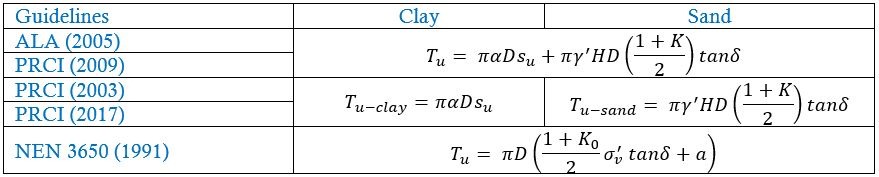
Where su = undrained shear strength of clay, α = adhesion factor for clay, γ’ = effective unit weight of soil, K= earth pressure co-efficient, δ = interface friction angle between pipe and soil and a = adhesion, as a function of type of soil and time elapsed since backfilling, approximately equal to drained cohesion
The only difference among the equations as listed in Table 1 are ALA (2005), PRCI (2009) and NEN 3650 used a combined expression by adding both equations for sand and clay, whereas PRCI (2003, 2017) used separate equations for sand and clay. However, a single additive expression for both clay and sand should not be used in pipe-soil interaction studies as such expression is inconsistent with foundation engineering concept (Oswell 2016).
NEN (3650) states that cohesion mainly determines the shear strength in clay soils. However, the contribution of inter-particle friction is also considered in NEN 3650 (1991). For saturated clay, the undrained friction angle is usually less than 5°. Therefore, at normal pipeline depths, the effects of friction angle are negligible compared with the effect of adhesion. As the water content is reduced, the undrained friction angle will increase rapidly for the same adhesion.
Therefore, from soil mechanics concept, PRCI (2017)’s separate equations for clay and sand are more practical compared to ALA (2005)’s single additive equation. However, although both PRCI (2017) and ALA (2005) equations look similar, there are differences in the definition of the terms between these two guidelines, which will be discussed in the following sections.
For Clay:
Maximum axial load per unit length for clay, ![]()
The value of α, the adhesion factor, as a function of the undrained shear strength, is generally estimated based on back-calculations from pipe load test results. Two major definitions of α can be found in the current design guidelines as reported in Table 2.
Table 2: Definition of α
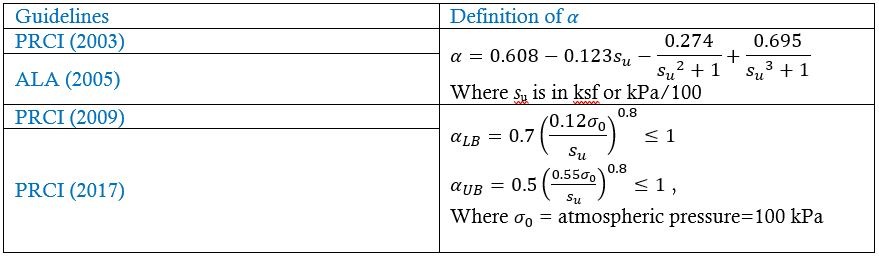
Figure 1(a) shows α as a function of su for the equations listed in Table 2 and Figure 1(b) shows Axial spring stiffness values as a function of su based on α as defined in Table 2.
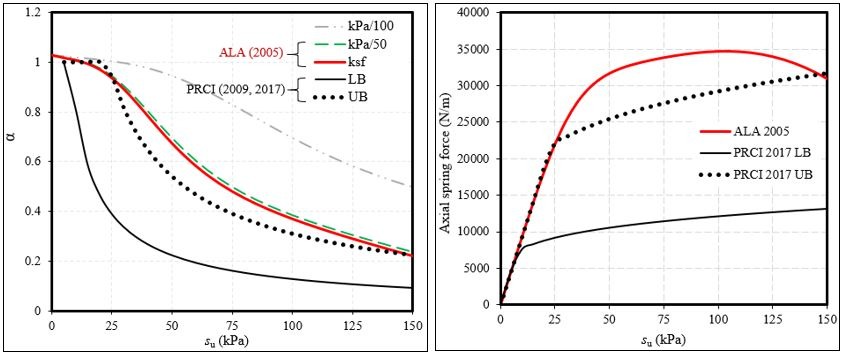
Figure 1: (a) α as a function of su , (b) Axial spring stiffness as a function of su
The PRCI (2003) and ALA (2005) definition for α has an error. The definition of Tu for clay was originally developed for α in units of ksf and the conversion is 1 ksf ≈ 1kPa/50; not kPa/100. It is also clear from Figure 1(a) that kPa/100 (grey line) is not the representative definition of α. Therefore, “kPa/100” in Table 2 should replaced with “kPa/50”. A significant difference in α exists between ALA (2005) or PRCI (2003) and PRCI (2009, 2017) equations (Figure 1). Figure 1(a) shows that ALA (2005) equation overestimates α value for su ≈ 25 – 150 kPa compared to PRCI (2009, 2017) equations. However, PRCI (2009, 2017) UB equation gives higher α for su ≈15 – 25 kPa (Figure 1a).
Figure 1(b) shows that there is a significant difference in the axial spring force value defined by PRCI 2017 and ALA 2005. PRCI 2017 recommends using both upper (UB) and lower (LB) bound estimates for the α (Figure 1b). In most cases, assuming an upper bound on the axial soil spring force will tend to lead to higher levels of computed pipe strain. For this reason, ALA (2005) has been largely based upon enveloping the maximum α observed from full-scale tests. However, it is possible for a pipeline configuration to experience higher strains with a lower value of α. This is most often the case when lower axial soil spring value results in high pipeline tension being transferred to a more vulnerable location (e.g. a valve station or a sharp bend) instead of to the soil (PRCI 2017).
Therefore, attention should be paid to the type/nature of problem being analyzed before using the axial soil spring stiffness (UB or LB; ALA 2005 or PRCI 2017). For example, for landslides along the pipeline, where soil pushes the pipeline, using αUB to calculate the axial soil spring stiffness might be conservative. However, αLB would provide the conservative results for pipeline stress analysis, where pipeline pushes the soil (Oswell 2016).
The test results of Cappelletto et al. (1998) indicate that the use of an effective stress model, which is recommended by the Dutch code NEN 3650 (1991) as listed in Table 1, rather than a total stress one appears to be more appropriate to predict the longitudinal pipe-soil interaction forces for both frictional and cohesive soil. This is because the thickness of the shear zone adjacent to the pipe is very thin and excess shear generated pore pressures dissipate very quickly with time.
Furthermore, Scarpelli, Sakellariadi and Furlani (2003) argued that the PRCI (2003, 2017) equation for clay is inappropriate for pipelines even for clay as failure of the pipeline under axial load is always a drained condition. Therefore, for both sand and clay, they suggested to use PRCI (2003, 2017) equation for sand.
For Sand:
For a pipeline buried at H from the ground surface, axial yield stress can be defined as ![]()
By integrating around the circumference of the pipe,
Maximum axial load per unit length for sand, ![]()
Where, δ is the interface friction angle between pipe and soil and can be defined as δ =fϕ. Here the weight of the pipe and its content is neglected. However, Dutch code NEN 3650 (1991) states that the weight of the pipeline and its contents has a significant effect on the friction acting on the pipeline and should be considered. The recommended values of interface friction co-efficient, f for different coatings of the pipe as defined by the current design guidelines are listed in Table 3.
Table 3: Recommended values for f
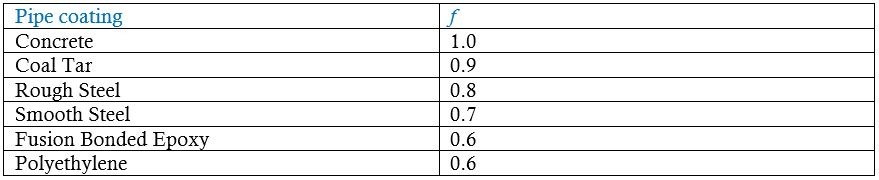
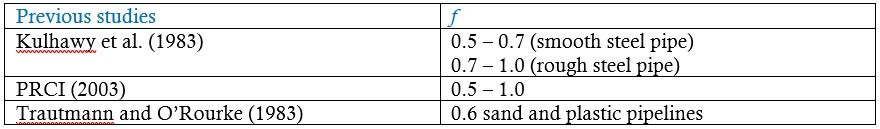
The recommended values of f are consistent from the values obtained from previous studies as shown in Table 4. Therefore, using Table 3 for f to calculate the axial spring stiffness for sand is reasonable.
Table 4: Values of f from previous studies
Apart from f, there is a significant difference in the definition of earth pressure co-efficient (K) as recommended by the design guidelines as shown in Table 5.
Table 5: Recommended values of K
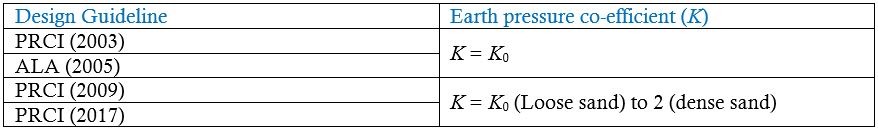
There is a wide debate for the K value for soil. K ranges from 0.5 for loose sand to 2.5 for dense sand (Oswell 2016). However, Oswell (2016) recommended to use K = 0.5-1.0 with an average of 0.75, given that pipeline backfill is typically not well compacted. Therefore, care should be taken in using K before defining the axial soil stiffness for sand as the axial stiffness largely depends on K.
Figure 2 shows the variation of peak axial spring force for sand with K for a set of parameters.
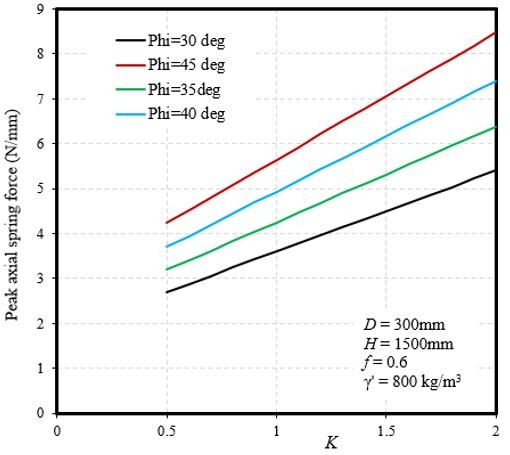
Figure 2: Peak axial spring force vs K
As shown in the Fig. 2, the peak axial spring force for sand varies widely with ϕ and K. For example, for ϕ = 45°, K = 0.5 gives Tu-sand ≈ 4.2 N/mm, whereas K = 2.0 gives Tu-sand ≈ 8.5 N/mm. Therefore, care should be taken before selecting K and ϕ to define the appropriate axial stiffness.
Karimian (2006) conducted some physical tests on axial pipe-soil interaction in sand at the University of British Columbia. The red broken line in Figure 3 shows a test, originally named as AB-4 in Karimian (2006), result on dense sand. The sand properties are shown in the inset of Figure 3.
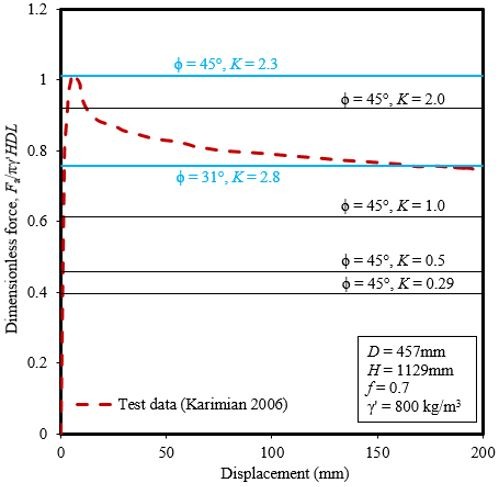
Figure 3: Prediction of PRCI (2017) equation to the physical test result of axial pipe-soil interaction
Figure 3 shows that the normalized axial force increases with axial displacement, reaches the peak and then decreases gradually with further displacement. There is a significant difference in the forces at peak (~1.01) and at post-peak (~0.75) at large displacement (~200 mm). Therefore, question remains which value needs to be used because in either ALA (2005) or PRCI (2017), we are defining a constant axial force; not the post-peak axial force.
Furthermore, another question remains what should be the appropriate values for δ and K in the equation of PRCI (2017) for sand as listed in Table 1? For example, Karimian (2006) conducted the Direct Shear test on the specified sand in Figure 3 and found ϕpeak = 43°- 46°. Now if we use ϕ = 45° and K = 1 – sinϕ = 0.29, which is a common industry practice, we are predicting ~60% lower axial force than the practical case. Even with K = 0.5 or 1.0, we are still well below the actual axial force obtained from the physical test (Figure 3). Now with K = 2.0 we can predict an average value (~9% lower than the peak) between peak and post-peak, however, same question remains whether we should aim for peak or post-peak axial force! With ϕ = 45° and K = 2.3 we can predict the peak axial force (Figure 3); however, K is beyond the limit of 2 as defined by PRCI (2017). Similarly, with ϕ = 31°, which is critical state friction angle of sand, and K = 2.8, we can predict the post-peak axial force but again, K value is higher than the limit imposed by PRCI (2017).
Summary:
The major differences in axial soil spring definition between ALA (2005) and PRCI (2017) are as follows:
- PRCI (2017) has recommended separate equations for sand and clay instead of a single additive equation as recommended by ALA (2005).
- For clay, ALA (2005) has recommended one equation for defining adhesion factor (α) whereas, PRCI (2017) has recommended two equations for both upper bound (UB) and lower bound (LB) estimation of α.
- For sand, ALA (2005) recommended to use earth pressure co-efficient (K) as equal to K0, whereas PRCI (2017) recommended a range of K (=K0 ̶ 2) to be used depending on the relative density of sand.
Considering the above differences, PRCI (2017) appears to be more updated and practical, compared to the ALA (2005), for use in the pipeline design and analysis. However, a number of questions/loop holes have been identified from this review, which require further research.
Interested in similar topics? Read our other publications on Lateral pipe-soil interaction or Upward pipe-soil interaction.